Case (5) Analysis of specific financial data
Project II.
Case details
Company A is a public fund management company headquartered in Guangzhou. Among all the fund products issued by the company to the public, there is a fund named "New Financial Equity Fund", which has an investment strategy of selecting A-share market financial stocks with core competitive advantages, sustainable growth potential and relatively reasonable valuation levels. As at the end of May 2020, the fund's long positions include Pudong Development Bank (600000), China Merchants Bank (600036), Haitong Securities (600837), Huatai Securities (601688), Ping An of China (601318) and China Taibao (601601). Assume you are a fund manager's assistant at Company A. Your daily job is to assist the fund manager of the New Finance Equity Fund to track and analyse the stocks invested. At the request of the fund manager, you are required to complete 3 programming tasks in Python.
Programming tasks
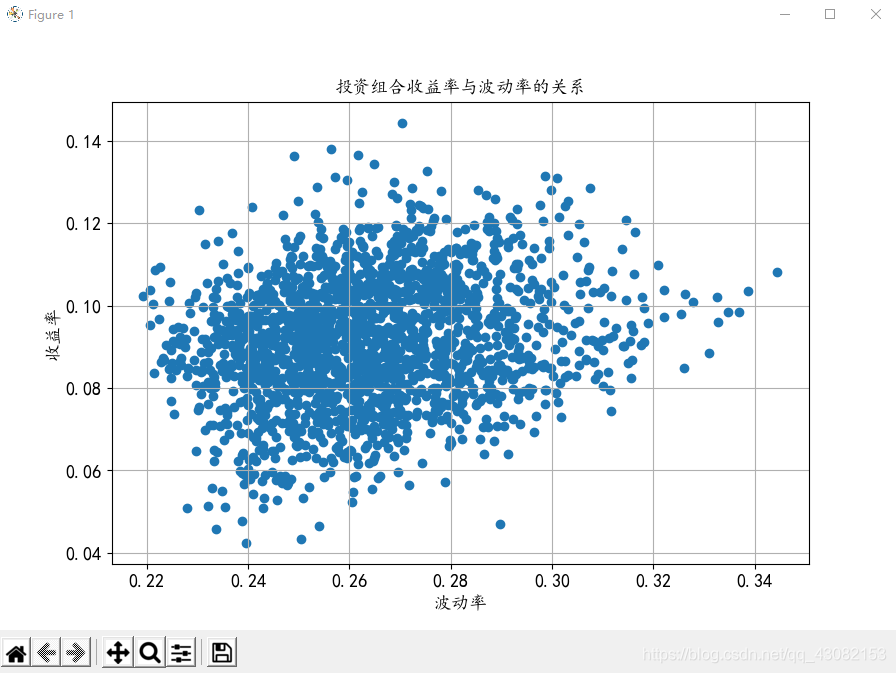
(1) Obtain the closing prices of the 6 stocks for the period from 1 January 2014 to 31 May 2020 and calculate the daily return, annualised average return and annualised return volatility for each stock, using the natural logarithm for calculating the daily return. (2) For the six stocks, construct a portfolio, generate a random array including the allocation weight for each stock (the weights total 1), and calculate the annualised average return and annualised return volatility for the portfolio allocated with that weight. (3) For 6 stocks, randomly generate an array of 2,000 different stock allocation weights, and use this to calculate the corresponding 2,000 different annualised average portfolio returns, annualised return volatilities, and plot them as scatter plots on an axis with annualised return volatilities in the horizontal coordinate and annualised average return in the vertical coordinate.
Start programming.
# -*- coding: utf-8 -*-
"""
Created on Wed Sept 23 8:59:40 2020

@author: mly
"""
import numpy as np
import pandas as pd
import matplotlib.pyplot as plt
from pylab import mpl
mpl.rcParams['font.sans-serif'] = ['KaiTi']
mpl.rcParams['axes.unicode_minus'] = False
stock_price=pd.read_excel('期末案例二.xlsx', sheet_name= "期末案例",header=0,index_col=0) #Importing external data
stock_price=stock_price.dropna()
#(stock_price/stock_price.iloc[0]).plot(figsize=(9,6),grid=True) # normalize the stock price to 1 for the first trading day of 2014 and visualize
stock_return=np.log(stock_price/stock_price.shift(1)) #Calculating the daily return of a stock
stock_return=stock_return.dropna() #Delete the row with the missing value
return_mean=stock_return.mean()*252 #Calculating the average annualised rate of return on equities
print('2014年至2020年5月的日收益率\n',stock_return.round(6)) #Retain 6 decimal places
print('2014年至2020年5月的年化平均收益率\n',return_mean.round(6)) #Retain 6 decimal places
return_volatility=stock_return.std()*np.sqrt(252) #Calculate the annualised return volatility of a stock
print('2014年至2020年5月的年化收益波动率\n',return_volatility.round(6))

#Task 2
x=np.random.random(len(return_mean.index)) #6 random numbers from 0 to 1 drawn at random from a uniform distribution
w = x / np.sum(x)  # Generate an array of random weights
return_cov=stock_return.cov()*252 #Calculate the covariance between the returns of each stock
print(return_cov)
return_corr=stock_return.corr() #Calculate the correlation coefficient between the returns of each stock
print(return_corr)
Rp=np.dot(return_mean,w) #Calculate the annualised rate of return of the portfolio
Vp=np.sqrt(np.dot(w,np.dot(return_cov,w.T))) #Calculate the annualised return volatility of the portfolio
print('用随机生成的权重计算得到投资组合的年化收益率',round(Rp,6))
print('用随机生成的权重计算得到投资组合的年化收益波动率',round(Vp,6))

#Task 3
x_2000=np.random.random((len(return_mean.index),2000)) #A random number of 0 to 1 in 6 rows and 2000 columns drawn at random from a uniform distribution
w_2000=x_2000/np.sum(x_2000,axis=0) #Generate an array containing 2000 sets of random weights
Rp_2000=np.dot(return_mean,w_2000) #Calculation of 2000 returns for different portfolios
Vp_2000=np.zeros_like(Rp_2000) #Generate an initial array of 2000 different return volatilities for the portfolio
for i in range(len(Rp_2000)):
    Vp_2000[i] = np.sqrt(np.dot((w_2000.T)[i], np.dot(return_cov, w_2000[:, i])))
plt.figure(figsize=(9,6))
plt.scatter(Vp_2000,Rp_2000)
plt.xlabel(u'波动率',fontsize=13)
plt.ylabel(u'收益率',fontsize=13,rotation=90)
plt.xticks(fontsize=13)
plt.yticks(fontsize=13)
plt.title(u'投资组合收益率与波动率的关系', fontsize=13)
plt.grid('True')
plt.show()
Presentation of results